I’ve been thinking about data journalism recently as being like prospecting for oil.
There are infinite riches out there, waiting just below the surface.
All you have to do is drill in the right place, extract the raw material, process it in the right way and you have liquid gold!
There’s also a race to conquer this new frontier and master the techniques of refinement.
You might be surprised to know the government has released tens of thousands of data sets over the past few years – and around two thirds have never even been opened or analysed.
For the regional press, the prize here is great content and for regional media groups like JPIMedia, where I work, it can be extracted once and used in many different markets.
There are other trailblazers out there in our sector – notably the Reach Data Unit led by the redoubtable David Ottewell and his team of analysts and reporters – and I’d recommend you check out their work.
But at JPIMedia, we’re also on the big data journey. We are trying lots of different approaches; here are a few recent steps:
The prize is great content and for regional media groups, it can be extracted once and used in many different markets.
Learning from the experts
JPIMedia is one of the regional media groups involved in Local News Partnerships, a collaboration with the BBC, which employs reporters to cover local authorities across the UK.
A side project of this is the BBC Shared Data Unit in Birmingham. Our partnership allows us to second reporters to the unit for three months at a time to learn data journalism techniques and to put these skills into use on story packages which are made available to the whole of the regional press and the BBC network.
Since 2017, we have sent four reporters off to be trained (with three more scheduled to go this year). On their return, they are expected to train their colleagues and spread the learning across the group, as well as produce data-driven content.
At the BBC, the reporters learn how to take publicly-available data, often in spreadsheet format, process it and turn it into stories.
And if the data is not publicly-available, they get it via Freedom of Information requests, with expert training in how to frame and refine requests so authorities are unable to avoid them.
They learn everything from basic coding to visualisation.
And they get expert on-the-job help from BBC data journalists, as well as formal training from top quality academics such as Professor Paul Bradshaw from Birmingham City University.
You don’t need to be a maths genius
The secondees are journalists, not computer scientists, so we expect them to approach this with the inquisitive mind of a reporter, not with the technical knowledge of a programmer.
Paul Lynch, a content editor from our Northants titles, was one of our first people to go to the BBC. He said: “Maths was never my strong point at school and spreadsheets brought me out in a cold sweat but within weeks, the team there had me zipping through Excel documents, 'cleaning' data, merging sheets and even having a go at scraping a website or two.”
Paul’s data project while on secondment was to analyse Department of Transport figures to show how UK bus route coverage had dropped to a 28-year low.
He provided content which was localised and used by hundreds of newspaper websites in our group and others, as well across the BBC network (Paul was interviewed extensively on the BBC News channel).
Paul worked with fellow secondees Annette Belcher from Reach and Claire Wilde, to analyse NHS figures on compensation claims for medical blunders from the 1990s.
This showed NHS mistakes from the 1990s are still costing taxpayers tens of millions of pounds a year – an amazing story nationally but with big implications for local health authorities.
This data was out there, freely available – but no-one had turned it into content.
Building this into the business
Claire Wilde was originally seconded to the BBC Shared Data Unit by Newsquest and since the start of this year, has taken on a new job as news editor for data and investigations, a group role at JPIMedia.
A complete convert to data journalism, Claire is now using these skills to produce data story packages for all our titles, as well as organising our BBC alumni to train their colleagues around the group and create content.
Here’s some examples:
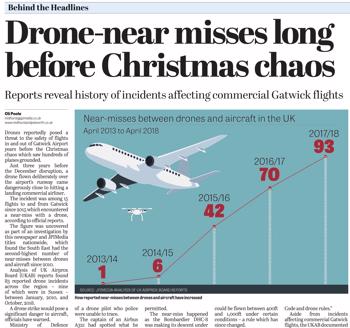
Last December, Gatwick went into 36-hour meltdown when a drone was reportedly flown near the runway.
Claire mined and analysed UK Airprox Board data to show that, in fact, this has happened hundreds of times over the past few years.
Her data package for our editors detailed drone near-misses at airports and on flight paths in our markets all over the UK. This data was out there, freely available – but no-one had turned it into content.
Are you a frustrated rail traveller?
Claire contacted all UK train operators and collated their data on compensation payments for delayed trains.
Surprise, surprise, there’s a massive difference in what you get paid, when and for what length of delay, depending on where you live and travel in the UK. We ran this story in many different forms for titles from northern Scotland to the south coast, as well as a UK-wide round-up for our national title, the i.
Again, the data was there for the taking.
Think the High Street is in trouble? Well, actually there’s been a huge increase in the number of repair shops in town centres all over the country – people are making do and mending everything from mobile phones to white goods.
That was a story mined from data from the Office for National Statistics and something called the Inter-Departmental Business Register and it says quite a lot about our changing attitudes to retail, austerity and even the environment.
The secondees are journalists, not computer scientists, so we expect them to approach this with the inquisitive mind of a reporter.
Plugged-in data
Claire has been joined in our fledgling data unit by Edinburgh-based reporter Aimee Stanton, who finished her BBC secondment in April.
During Aimee’s time at the BBC, she looked at the data around electric vehicles and how to charge them.
The government wants to “lead the world in zero emission vehicle technology” and, last year, 60,000 electric vehicles were registered.
So, you’d think there would be an infrastructure in place to charge your new electric car, so you could drive a range of more than the average 100 miles?
But… only 28 local authorities have taken advantage of government funding for on-street residential charge points. And more than 100 councils in England and Wales have NO plans to expand their electric infrastructure.
The distance between charging locations turns out to be a postcode lottery and transport campaigners say the government really needs to get its act together if electric cars are to be anything like realistic.
This data was out there, on the Open Charge Map website, and with the Department for Transport and the DVLA – it just needed Aimee to pull it together and tell the story.
The content was used everywhere and for JPIMedia, it gave us great story lines in Milton Keynes, Peterborough, Portsmouth, Lisburn, Falkirk, across Yorkshire and lots more places.
Long-form data investigations
A couple of years ago, we set up the JPIMedia Investigations Team – a virtual network of reporters working on long-form content packages, often with a campaigning tone.
The team has been using mass FOI requests and data analysis to uncover all sorts of stories.
By collecting data from courts and police up and down the UK, we showed that not a single person had ever received the maximum sentence for causing death by dangerous driving. This led to a commitment by the government to increase the maximum sentence to life imprisonment (they are yet to make good on this promise).
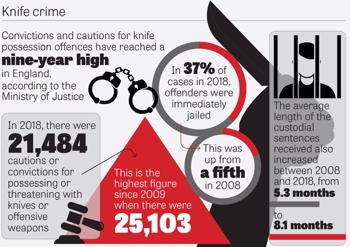
We also used data requests and analysis to show the true extent of NHS closure plans, the incidence of knife crimes in our schools and the hidden epidemic of suicides among military veterans.
These are all important national stories but also, by the use of case studies and localised commentary, they gave us great lines for our regions.
Visualising it
I’ve written in InPublishing before about the importance of seeing and processing stories, particularly complex ones, in a visual context.
Our data and investigations output is enhanced by the work of Tim Hopkinson and our graphics team at the JPIMedia Design Hub.
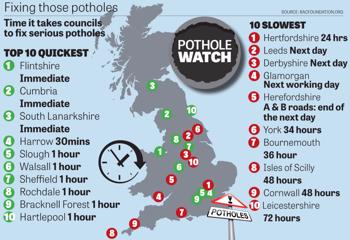
They produce devilishly simple infographics to accompany all of these stories and to tell the data story, whether it be comparisons, timelines, geographies, processes etc.
What started as a print project is now rapidly moving online, using Google Flourish and other tools to turn the data into interactive charts, maps and stories.
Data on the Radar
Over the past eighteen months, we have been working with Alan Renwick and Gary Rogers at PA Radar, an automated news service taking data-driven stories to the next level.
The reporters at Radar use publicly-available data (often from the Office for National Statistics) and write a carefully-constructed base story.
From the base, an algorithm creates hundreds of different stories, using the source data to change the variables coded into the text.
For JPIMedia, this means we get 100 different stories for every subject covered (based on our 100 local authority footprint) – around 700 different stories every week for all of our websites and newspapers on subjects as diverse as child tooth decay, house sale times and motorbike pollution.
Radar is a great project but I think it’s just the start.
You can expect to see more and more agencies offering these services and publishers like us using user-generated data and public statistics which are just sitting around out in cyberspace waiting to be turned into compelling journalism.