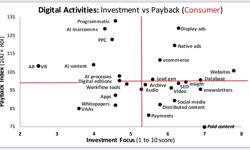
The benchmarking exercise, undertaken by the 99 publishers in the consumer, B2B, customer and news media sectors, provides the data for a diagnostic assessment in three areas:
- Front-end REVENUES. Where is the money coming from and how is that revenue profile changing?
- Back-end PERFORMANCE outputs, where the key metrics are turnover growth, profitability, productivity and corporate confidence.
- In the middle is the ORGANISATION. This links the inputs and outputs together through such things as company structure, culture, skills, business assets, change toolkit, etc. This is where the magic of running a successful business actually happens… or not!
We shall be looking at ‘performance’ and ‘organisation’ in future issues, but let us zoom in on ‘revenues’ now.
A key output from this year’s Publishing Futures is a real overview of just how diverse and varied the business models of individual publishers actually are. Yet every operation has five key revenue variables that drive it:
1. Ads versus audience revenues: the balance between revenues that come from advertisers (advertising, sponsorship, event exhibitors, etc) as opposed to end-users and readers. Across the 99 benchmarking companies, the average balance is currently 48:52 ads versus audience. The balance is shifting steadily towards audience – the forecast is that this ratio will have moved to 46:54 in two years’ time. This is a significant, structural shift, but it is happening too slowly for many companies who want to reduce their exposure to the vagaries of the advertiser stream.
2. Print skew: what proportion of company revenues come from print products as opposed to digital and other activities? Here the benchmark average is 55% of turnover coming from print currently, with a rapid reduction in two years’ time to 49%. Yet print’s resilience and digital’s weak monetisation are really highlighted in the revenue figures this year.
3. Revenue diversification. This is a key imperative for every media business. Yet it is clear that a number of companies are simply trying to do too many things at once with a resultant drop in product quality and company focus – what one respondent described as a slow “death by a thousand revenue streams”.
4. Geographical spread. There are felt to be great cross-border opportunities. The percentage of turnover coming from outside the UK is currently running at an average 31% for B2B companies and 12% for consumer, with both percentages predicted to rise significantly over the next two years.
5. Rate of change. Here there are two measures: how quickly are the revenue streams shifting; and how big is the rate of organisational change? Change is a given. Yet the willingness and ability to change varies massively from company to company. In addition, overly rapid change can destabilise and stretch an organisation to breaking point.
The chart maps the two dominant revenue variables: (1) the dependence on ad revenues set against (2) the dependence on print products: each dot is a publishing company. The chart demonstrates the massive range of revenue models that are operational in the media business with a number of “pure plays” at the extremes of both factors. Yet behind that explosion of dots with little apparent pattern, there are clusters of similarly focused companies and some important trends.
As an example, take the top right quadrant of the chart where the dependence on both print and ads is high – a highly dangerous combination and where there are a number of traditional legacy consumer publishers. Although it is the most vulnerable and unstable place on the map to be, the companies here are still by far the most profitable. Turnover growth is modest, but steady. Staff productivity is average and the revenue streams are beginning to diversify and shift. Yet organisational change is slow – most of the companies are simply not equipped for, committed to or confident about it. The future of companies here looks very mixed. Some will simply not survive the current turbulence, while others may still have profitable businesses – the question is for how long?
So, what are the conclusions of all this? Firstly, although no single media company is big enough to change the flow of what is happening around them, it is still possible to navigate within the current rather than simply being swept along helplessly or just drowning. Yet that takes a detailed understanding of the dynamics of each revenue stream and a really strategic, long-term view that few companies actually have. Secondly, not all change is good. Balancing the need to diversify against the dangers of over-stretching is a big issue. Thirdly, prioritise ruthlessly. No organisation is big enough or good enough to do everything they want to do at once. So, partnering is essential. And the old “one-in / one-out” discipline concentrates the mind wonderfully: to do something new means that I have to drop something else I am doing currently – and may have been doing very successfully for years. Yet sacred cows have a nasty tendency to die on you if you leave them alone for too long.


